Data Science
Linear regression
In statistics, linear regression is a linear approach to modeling the relationship between a scalar response (or dependent variable) and one or more explanatory variables (or independent variables).
Example: Systolic blood pressure of newborns Is:
6 Times the Age in days + Random Error
SBP = 6 * age(d) + e
Random Error May Be Due to Factors Other Than age in days
(e.g. Birthweight)
In linear regression, the relationships are modeled using linear predictor functions whose unknown model parameters are estimated from the data. Such models are called linear models.
It is assumed that the two variables are linearly related. Hence, we try to find a linear function that predicts the response value(y) as accurately as possible as a function of the feature or independent variable(x).
Let us consider a dataset where we have a value of response y
for every feature x:
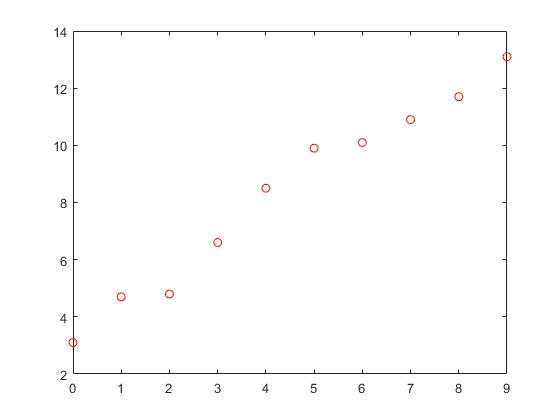
| X | 0 | 1 | 2 | 3 | 4 | 5 | 6 | 7 | 8 | 9 |
| Y | 2.1 | 4.7 | 4.8 | 6.6 | 8.5 | 9.9 | 10.1 | 10.9 | 11.7 | 13.1 |

How can we use a model to decribe this data? SLR
Consider the model function: y = α + β x , which describes
a line with slope β and y-intercept α.
In general such a relationship may not hold exactly for the largely unobserved population of values of the independent and dependent variables; we call the unobserved deviations from the above equation the errors.
Suppose we observe n data pairs and call them {(xi, yi), i = 1, ..., n}. We can describe the underlying relationship between yi and xi involving this error term εi by yi = α + β xi + εi .
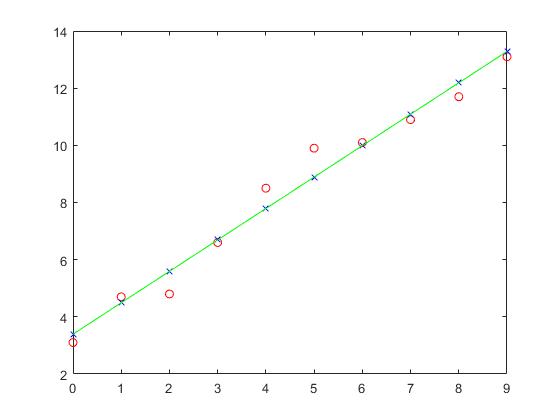
The goal is to find estimated values α_hat and β_hat for the parameters α and β which would provide the "best" fit in some sense for the data points.
Here, the "best" fit will be understood as in the least-squares approach: a line that minimizes the sum of squared residuals.<<<<-------WHY?

Try to write your code to figure out a linear model to describe the above data, and also test it on the following data.
| X | 9 | 8 | 7 | 6 | 5 | 4 | 3 | 2 | 1 | 0 |
| Y | 2.1 | 4.7 | 4.8 | 6.6 | 8.5 | 9.9 | 10.1 | 10.9 | 11.7 | 13.1 |
Here is the public dataset drawn from the U.S. Army Anthropometric Survey form University of Michigan
Try to use your program to build a Linear Model on the following dataset.
and test your model on the following dataset
Verify your prediction vs
ActualData
and caculate the sum of squared error

Other Performance Evaluation Functions
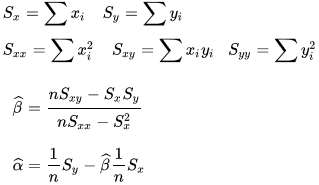
How can we solve the problem with Math?
